Bookmarks
Bookmarks are tabs on the edge of the visualization screen. Clicking one slides a panel in from the right, without navigating away from the graph.
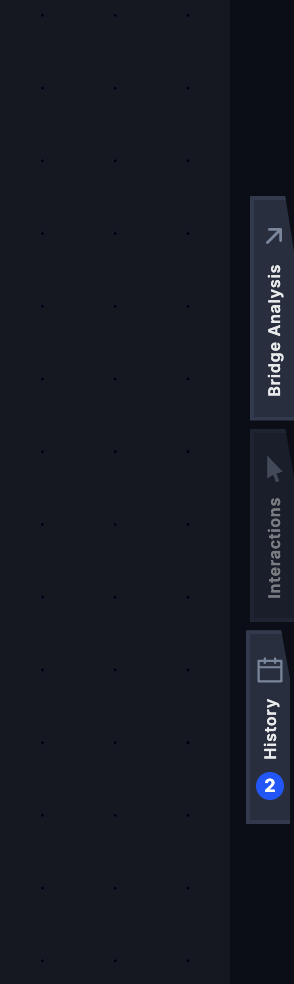
Each tab shows an icon, a title, and a counter where there is something to count.
The three bookmarks
| Bookmark | What it holds | Full guide |
|---|---|---|
| History | What was done in this visualization, and when. | History |
| Interactions | Direct transactions between two objects. | Interactions page |
| Bridge analysis | Every bridge check made in this visualization. | Bridge analysis |
Opening and closing
Click a tab to open it. To close the panel:
- click the same tab again,
- click the × in the panel header, or
- click the dimmed area beside the panel.
A greyed-out tab has nothing to show yet. The Bridge analysis tab stays inactive until you run your first check.
On phones and tablets
Panels open from the bottom or take the full screen, and can be dismissed with a swipe.
Last updated on