Dashboard
Overview
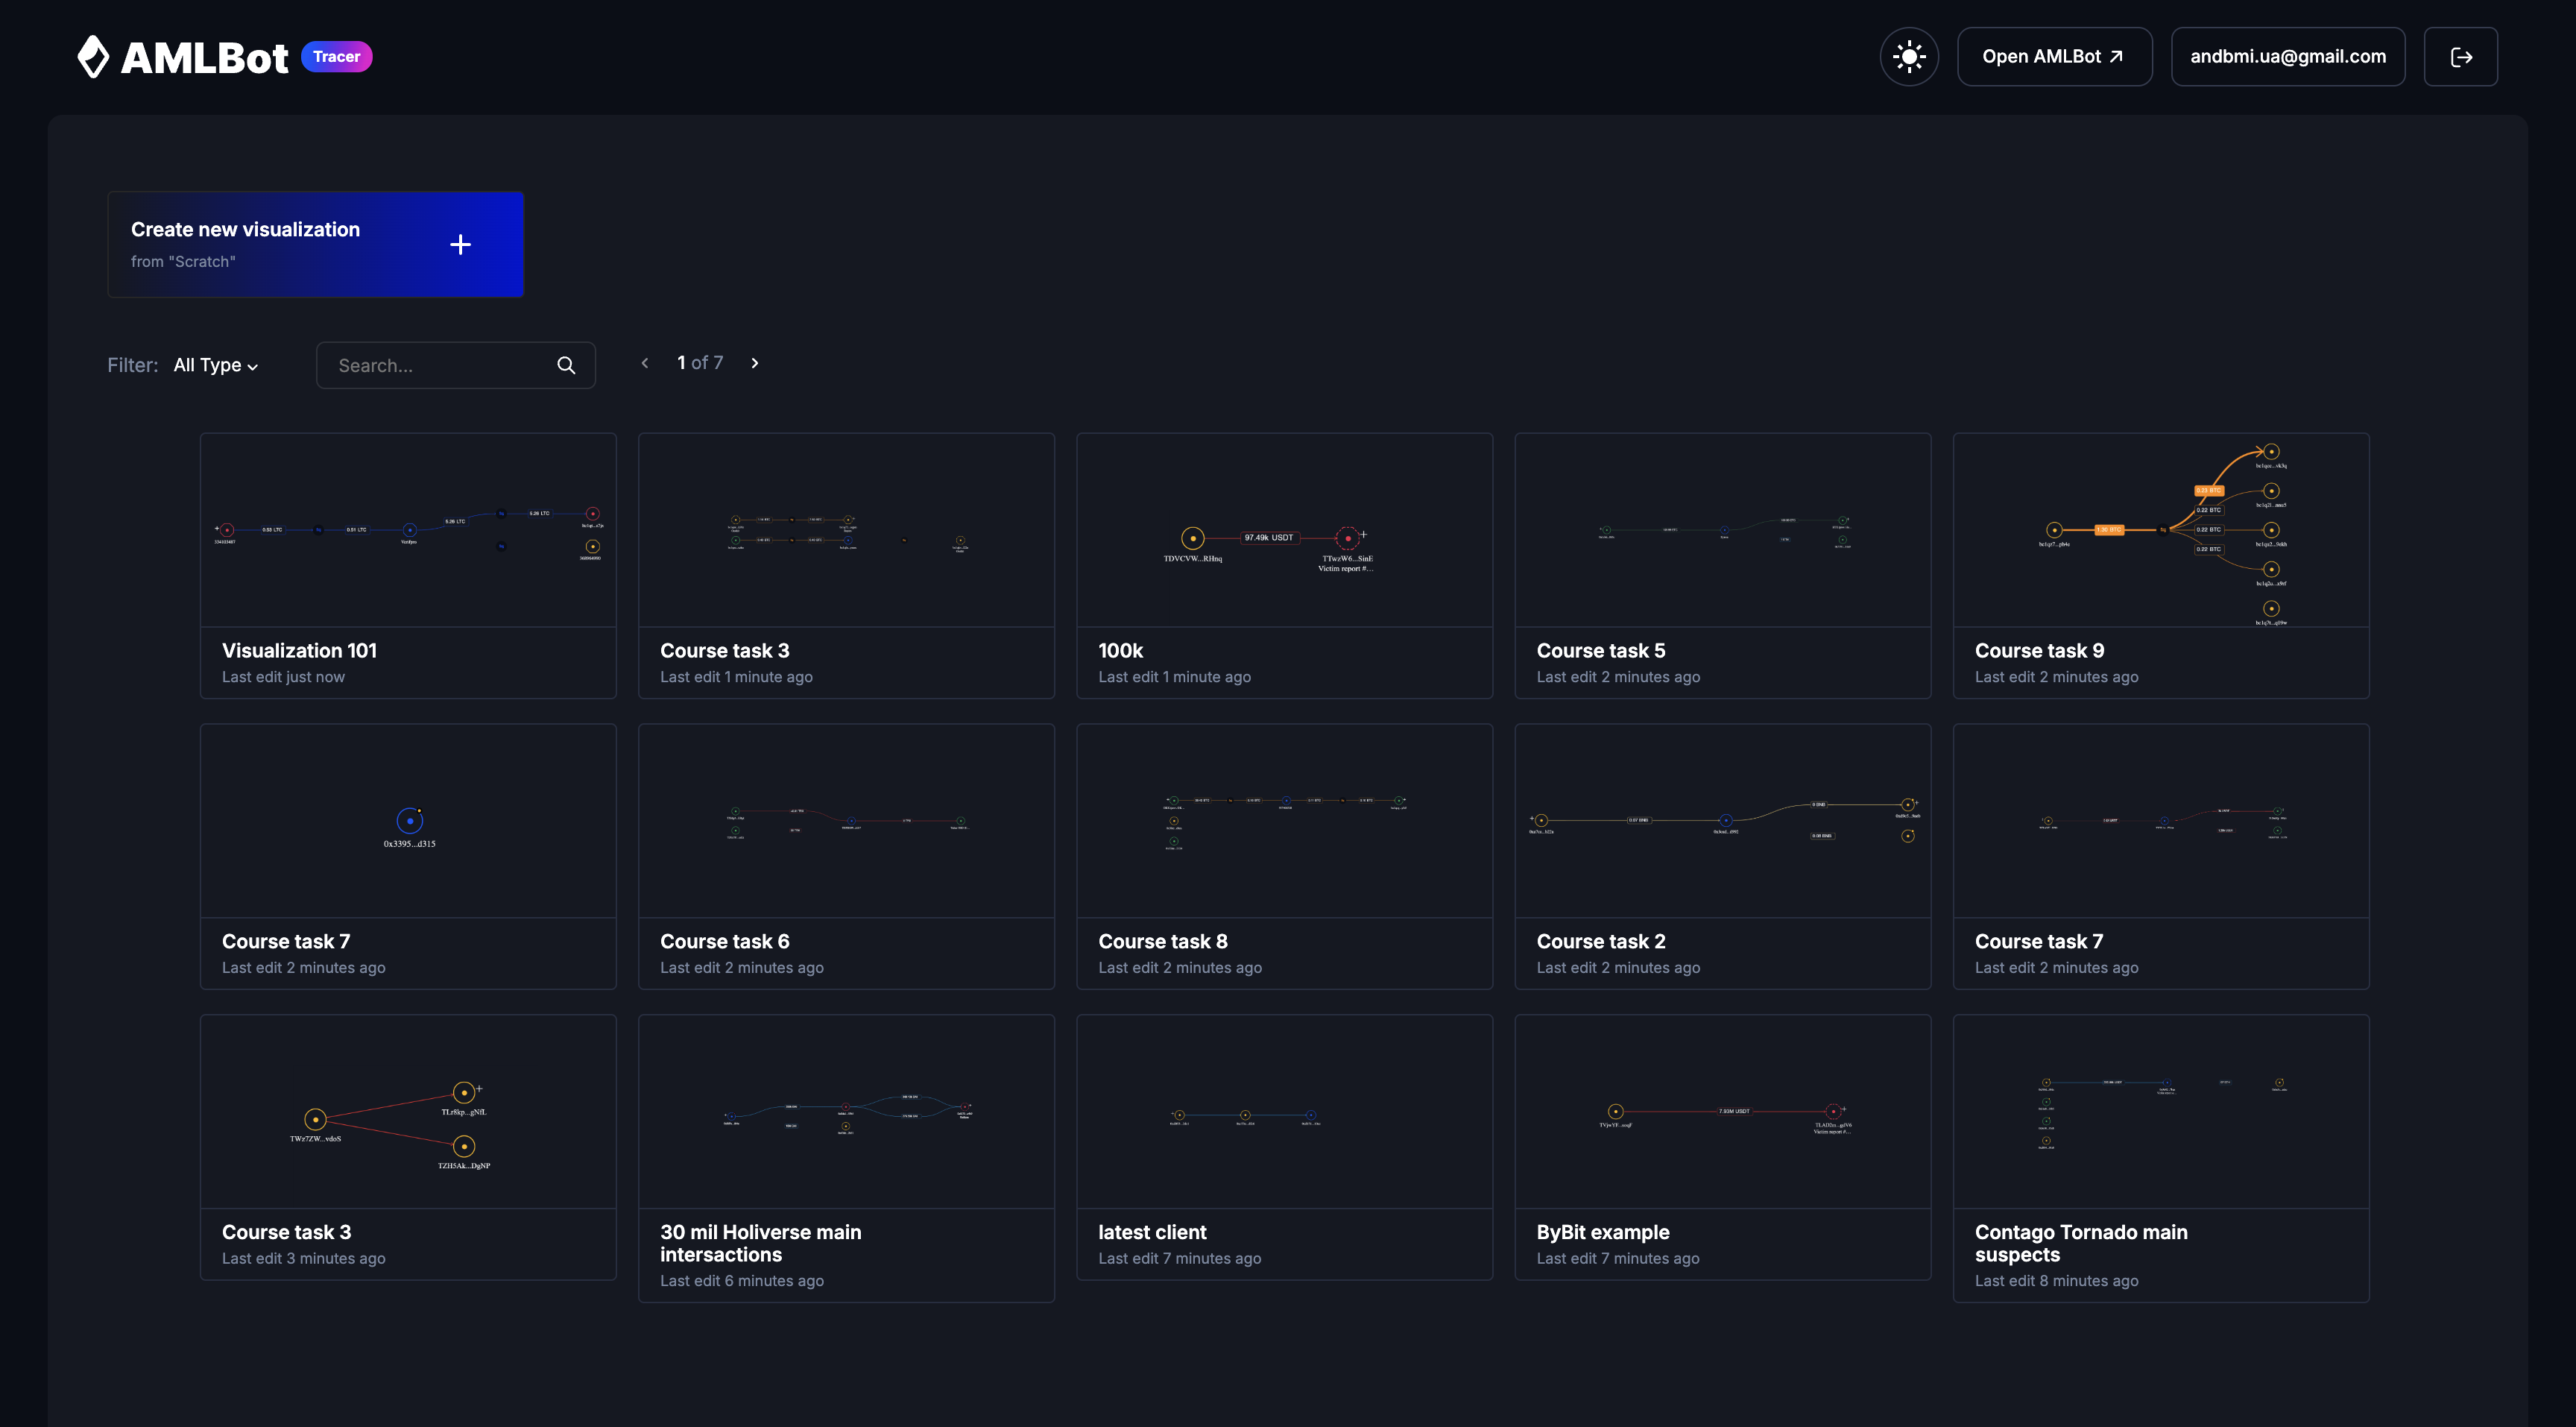
The dashboard provides an overview of the visualizations created by the user. Here you can start new visualizations, view existing ones, and manage your projects.
Features
- Create New Visualization: Start a new project by clicking the “Create new visualization”.
- View Existing Visualizations: See a list of your current visualizations with options to open, share, edit or delete them.
- Filter and Search: Easily find specific visualizations using the search bar or filter options.
Getting Started
Ready to create your first visualization? Follow these simple steps:
Tip: You can always revisit this guide from the dashboard sidebar!
- Create New Visualization: Click the “Create new visualization” button to begin your project.
- Search for Data: Enter an address or entity name (e.g., Binance) to search for data. Alternatively, input a transaction hash to visualize a specific transaction.
- Select Data: Choose the data you want to visualize from the results.
- Choose Visualization Type: Select type — Address wise or Entity wise — and pick a mode (default or connection). Note: If you search for an entity, you can only use entity-wise mode.
- ️Generate Graph: Click “Continue” to generate your interactive graph!
Last updated on