Visualization
Welcome to the Visualization page! Here, you can explore blockchain transactions and addresses (or entities) through an interactive and visually rich interface designed to make complex data easy to understand.
Information Blocks
- Visualization Canvas: Graphical view of blockchain instances and their connections.
- ️ Action Toolbar: Undo/Redo, comments, and more.
- Label Toolbar: Change labels, export data, save to dashboard.
- Search: Add addresses, transactions, or entities.
- Info Panel: Details on selected objects.
💡 Tip: Use the History feature in the Action Toolbar to undo or redo steps, and don’t forget to save or share your visualization!
Canvas Details
The History feature enables undoing or redoing the last step taken. You can also save, share, export, or delete the visualization as needed.
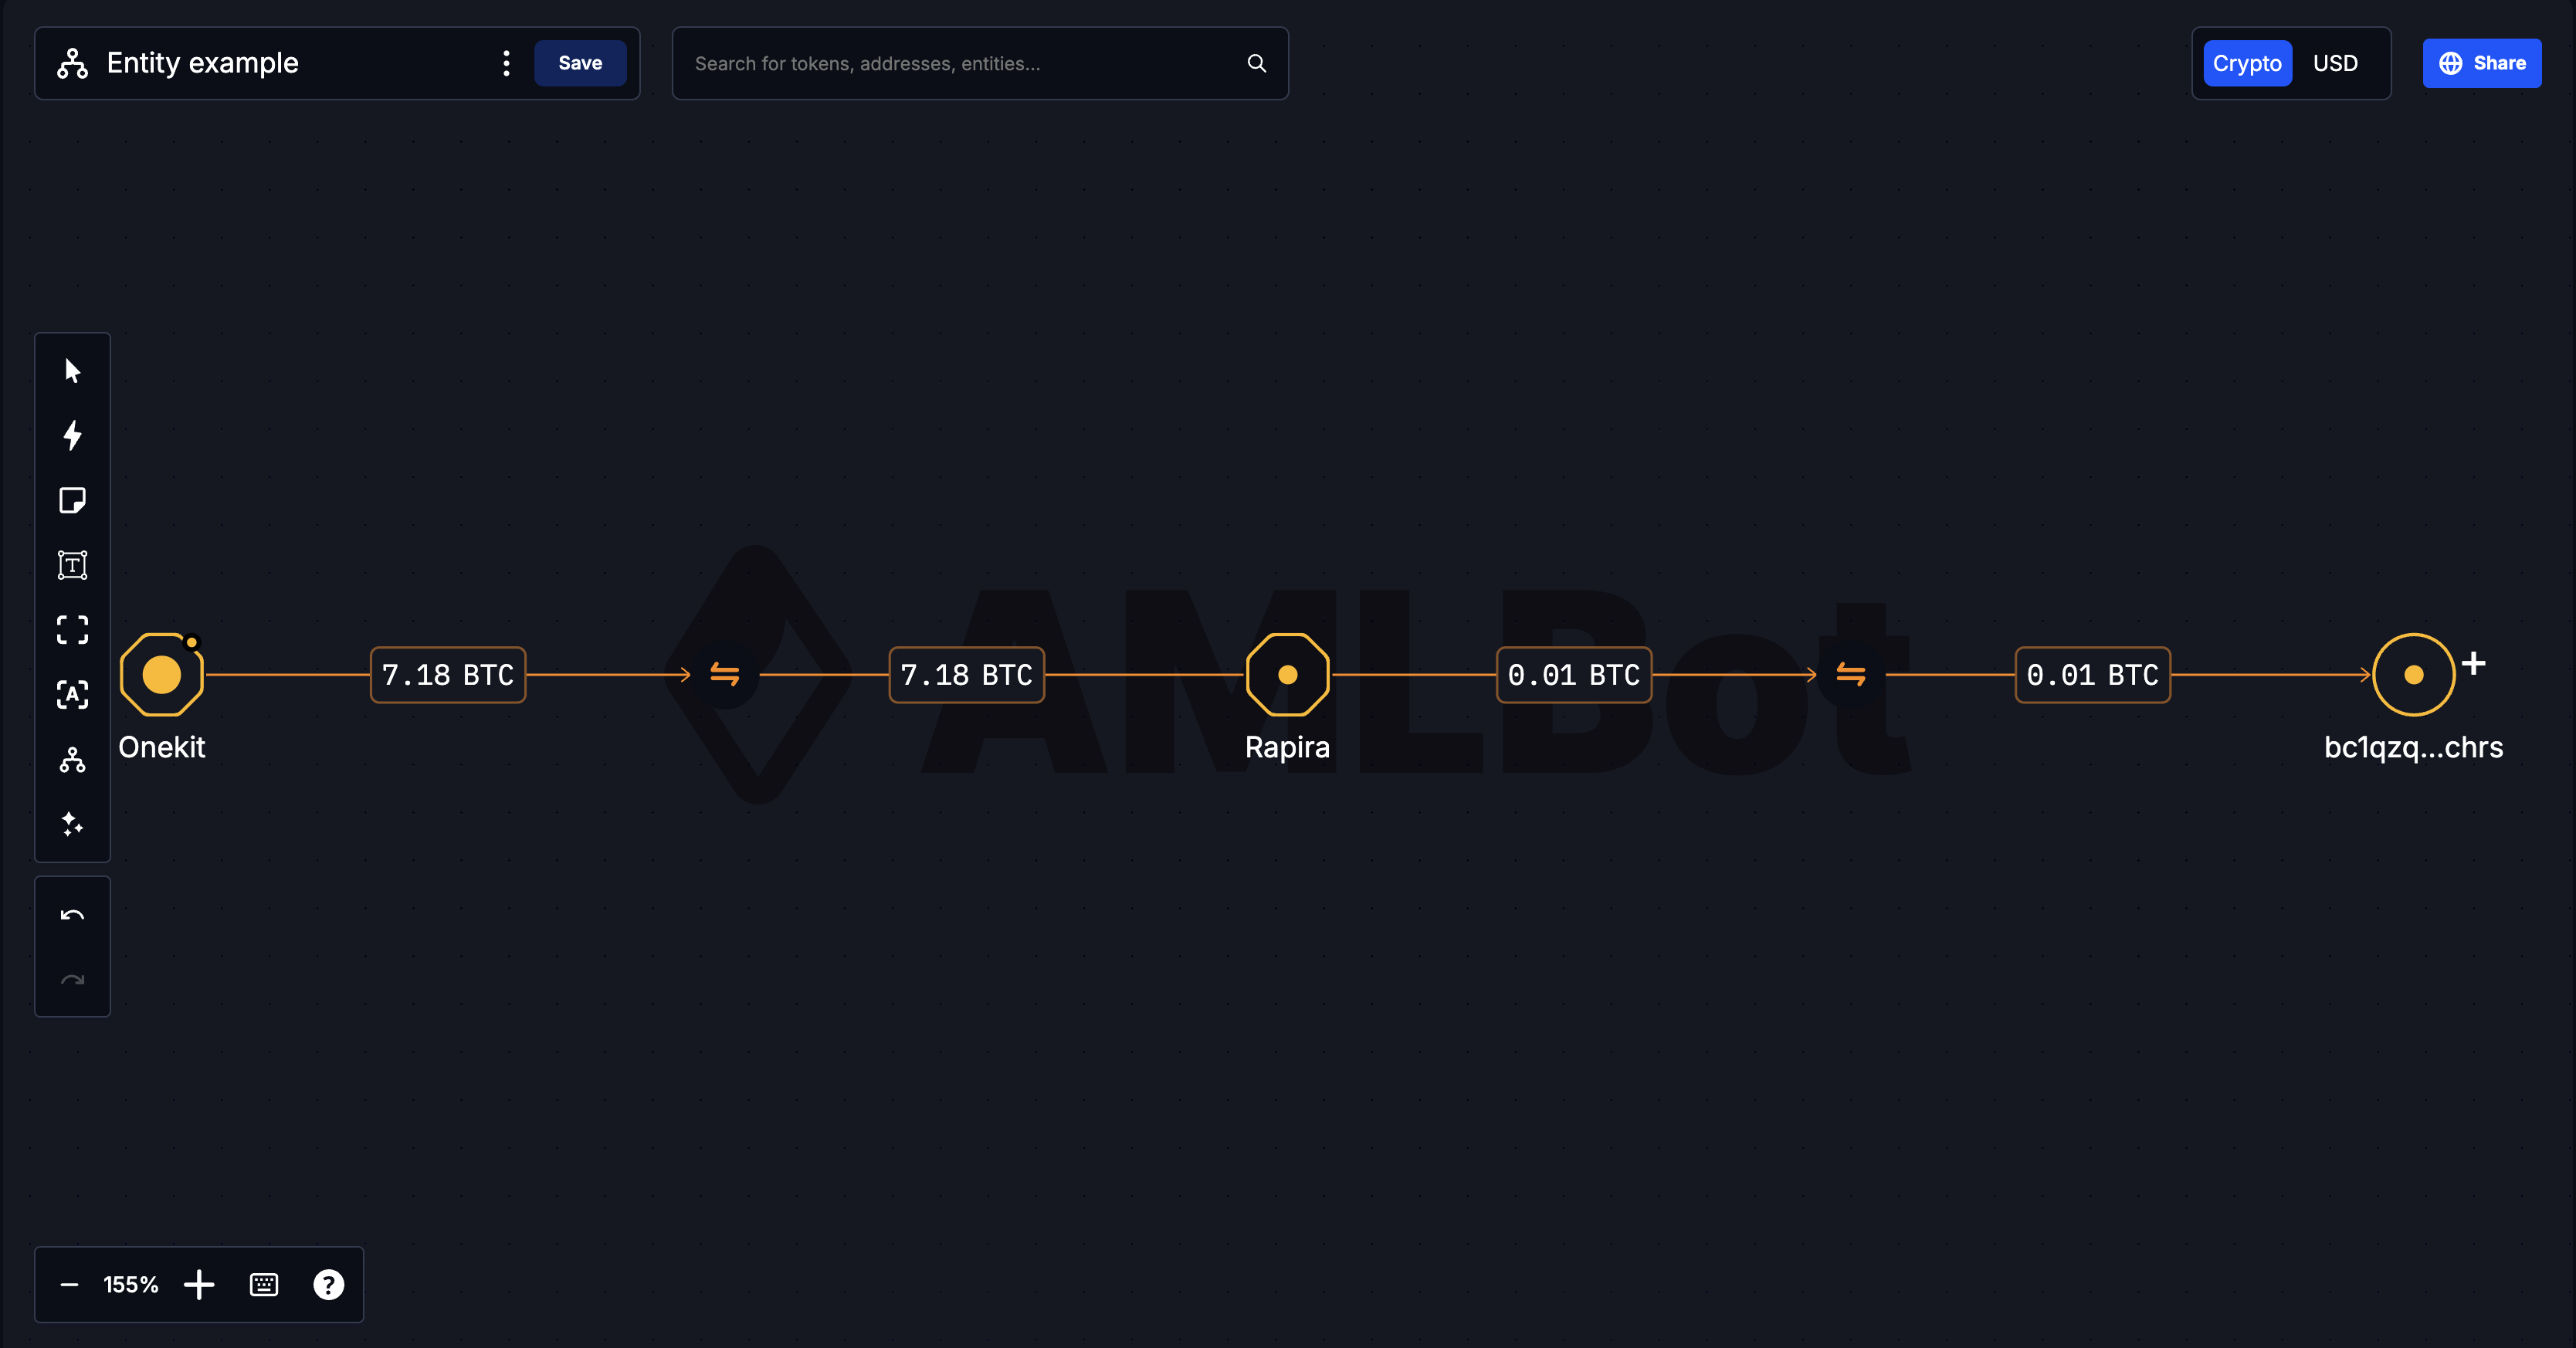
Visualization canvas contains addresses or entities connected by transactions:
Last updated on