Toolbars
We have a bunch of tools to help you with tracing and working with visualisation. You can find them in the toolbars on the left, top, and bottom sides of the visualisation canvas.
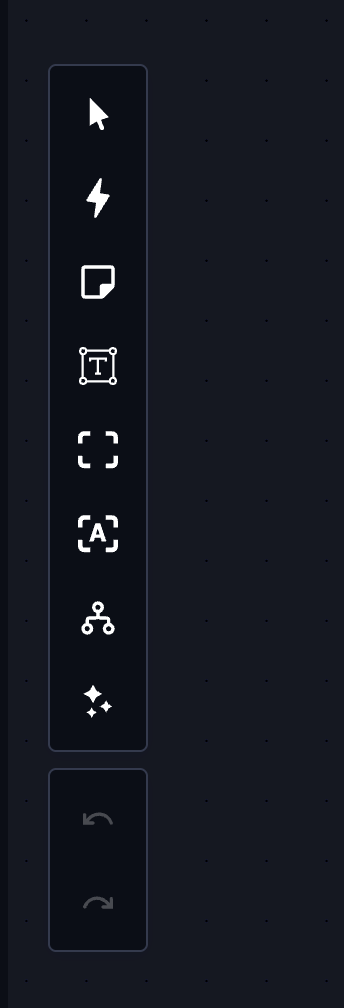
Left Side Toolbar
The left side toolbar contains tools for working with visualisation and the canvas:
- Undo/Redo: Undo or redo your last action on the canvas.
- Pan: Pan the canvas by dragging it.
- Fit to screen: Fit the canvas to the screen.
- Create comment: Create a comment on the canvas. Connect it to any object by dragging the connector.
- Create note: Create a note on the canvas. Connect it to any object by dragging the connector.
- Merged mode: Switch between merged and default mode. Merged mode combines multiple transactions between the same addresses/entities into a single connection line, reducing clutter and highlighting patterns.
- Fix position: Fix the position of the selected object so it won’t move when adding new objects.
- ️ Manual mode: In manual mode, objects are added close to connected objects. In automatic mode, objects are placed to avoid overlapping.
- Readonly mode: Prevent moving or deleting objects on the canvas.
💡 Tip: Use merged mode to simplify complex visualisations and spot patterns faster!
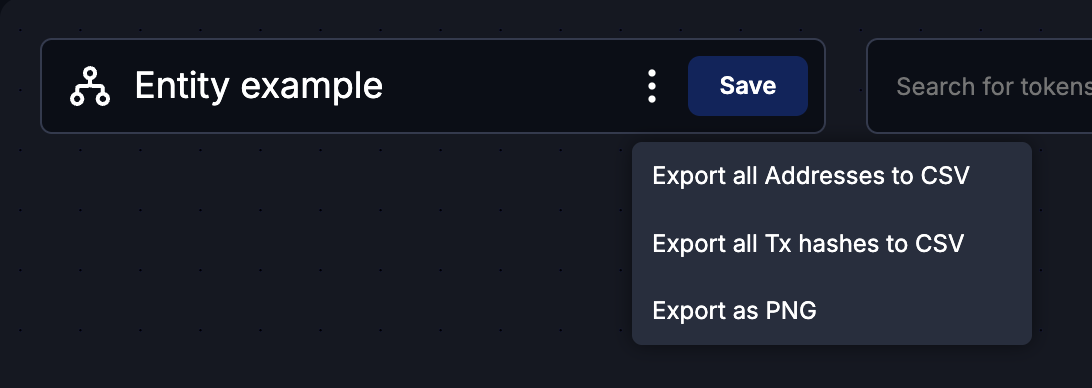
Top Section
- Labels: Change visualisation label, export data (address, transactions, image), and save visualisation.
- Search: Search for and add objects or batches (addresses, transactions, entities).
- Export data: Export addresses and transactions as CSV, or export the visualisation as a PNG image.
- Currency: Change the currency for displayed amounts and assets on hover.
- Share: Share the visualisation with others via a link.
- Create copy: For shared visualisations, create a copy in your account.
💡 Tip: Regularly save your visualisations to avoid losing progress and keep your work organized before closing the tab! Auto save works every 1 minute.

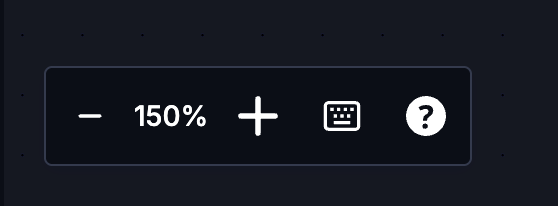
Bottom Left
- Zoom in/Zoom out: Zoom in or out of the canvas.
- Zoom percentage: See the current zoom percentage.
- ️ Shortcuts: View the list of shortcuts for the canvas. Use Escape to close any modal.
- ️ Icon: See all icons for every work type.
✨ Pro Tip: Use shortcuts to speed up your workflow and make tracing more efficient!
Export Options
You can export your visualisation data in various formats:
- CSV Export: Export addresses and transactions as CSV files for further analysis.
- ️ PNG Export: Export the visualisation as a high-quality PNG image for presentations or reports.
📢 Note: Export options are available in the top toolbar on hover of 3 dots. Choose the format that best suits your needs!